Data
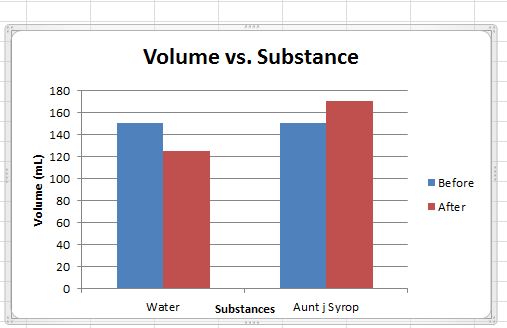
This graph shows the volume versus substance with the plain water and the Aunt j's syrup. Each substance was filled to 150mL in a beaker but as you can see the volume changed over a period of time. The volume level in the water decreased to 125 mL while the volume in the syrup went up to 170mL.
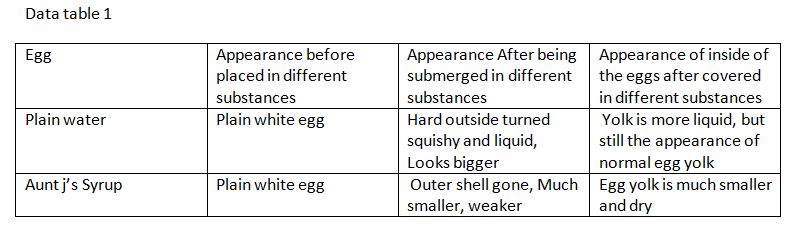
| data_table_one.jpg |
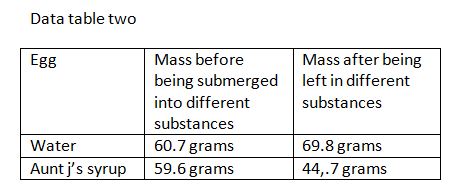
Data table two below
| capture.jpg |
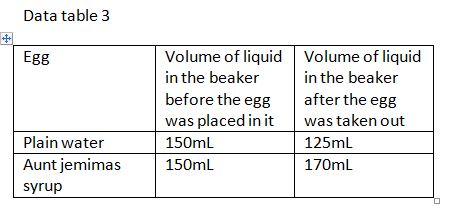
| data_table_3.jpg |
